If you use Lighthouse to measure your site’s performance, you might have seen the Avoid excessive DOM size warning before. It looks something like this:
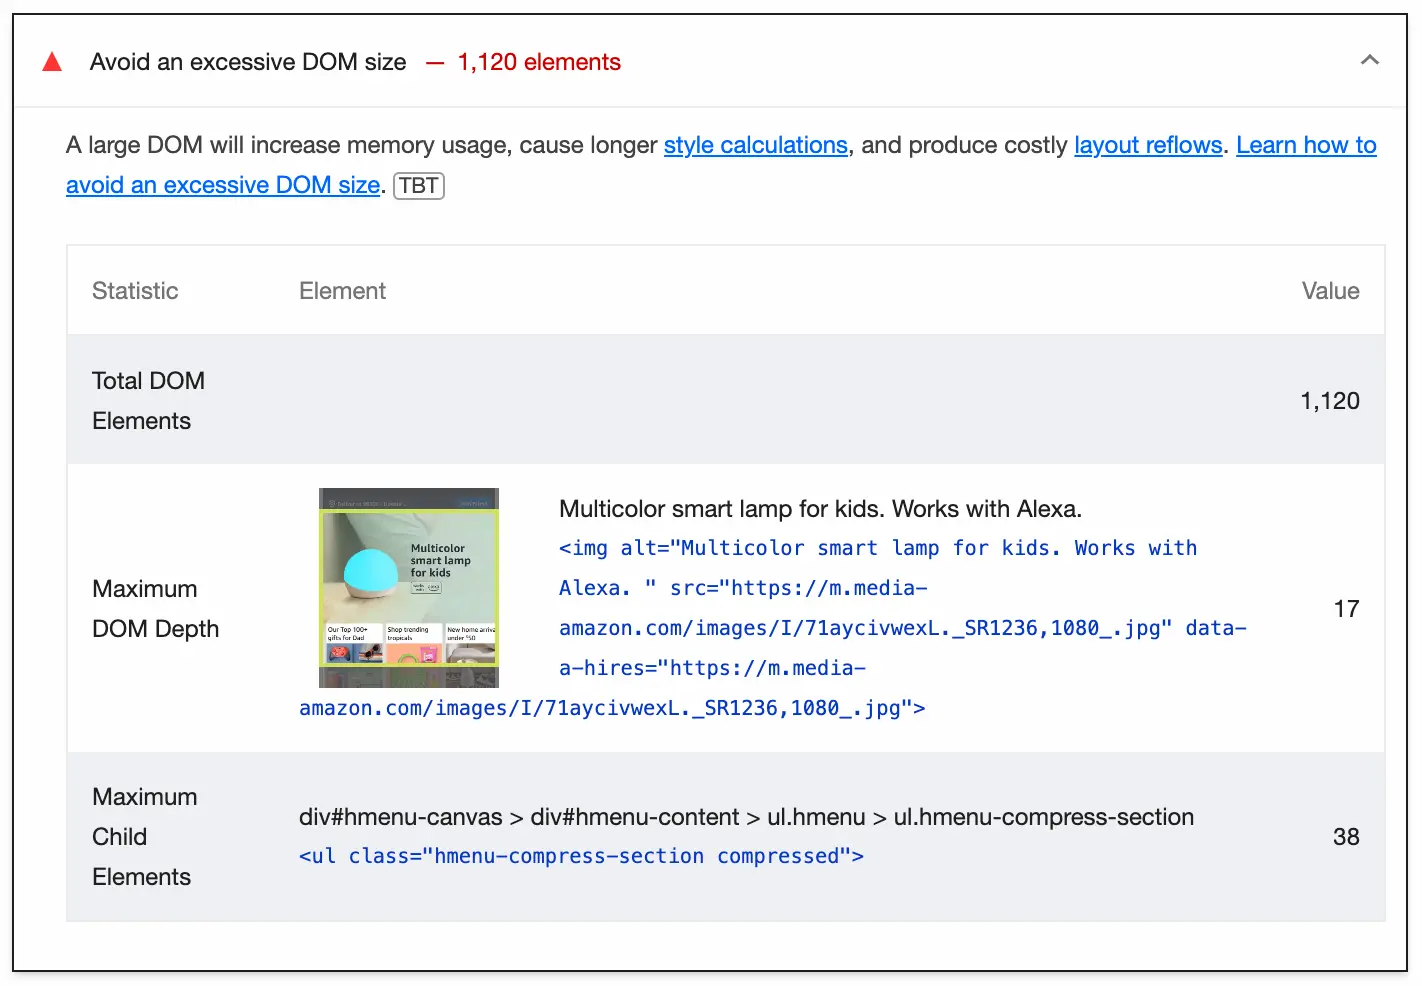
Lighthouse warns us about large DOM sizes because they increase memory usage and can produce expensive style calculations. Combined with all the other things going on on your site, this can have a significant impact on user experience, especially for users on lower-end devices.
While I was reading through a performance report for my site the other day, this warning caught my attention. But it wasn’t the total number of DOM elements that made me take a second look; it was the metric reported below it—Maximum DOM Depth.
Having spent a big chunk of time thinking about trees (the data structure, not the ones that grow in forests) while writing last week’s newsletter, the relationship between time complexity and a tree’s depth was still fresh in my head. So seeing this metric in the Lighthouse report immediately brought up a question:
🤔 How does DOM Depth affect rendering performance?
When we work with a tree data structure like the DOM, its depth has a lot to do with how fast operations such as lookups perform on them. Take a look at these two DOM trees:
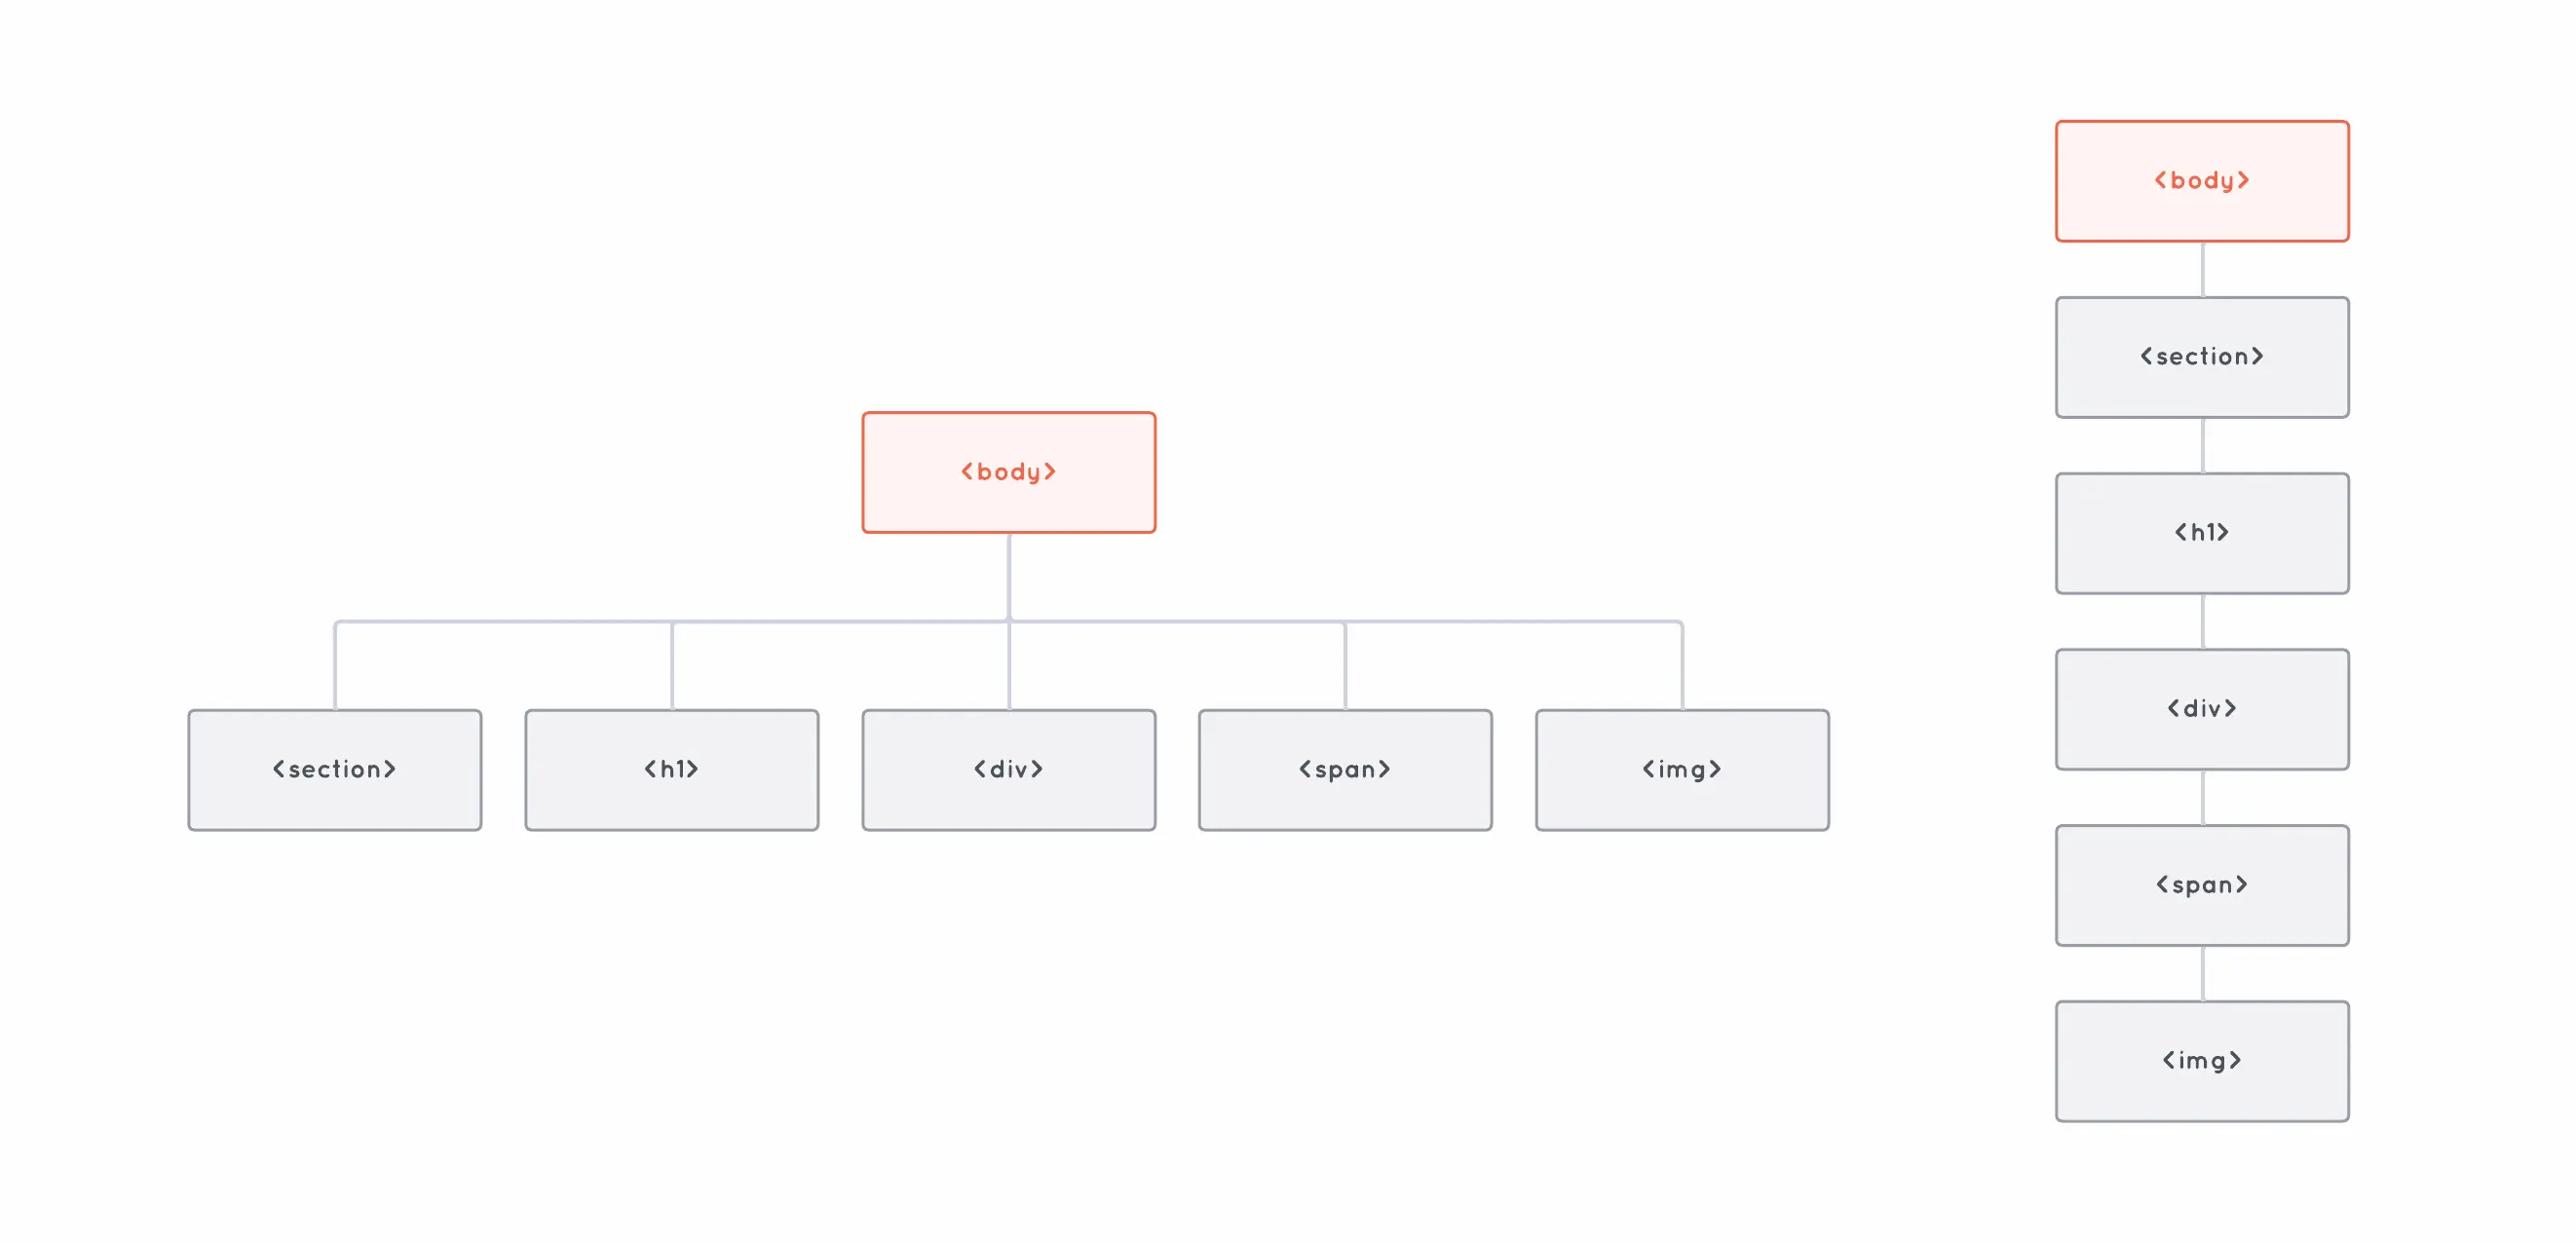
Both trees have the same number of elements, but one has a depth (or height) of 2, while the other has a depth of 6. The difference is important because the deeper a tree goes, the more operations it could take to access one of its elements.
For instance, imagine we wanted to access the <img> element starting from the root of the tree. On the shallow tree, it would take us only two operations to do so—finding the array of <body>’s children, and accessing the child at index 4:
body.children[4];With the deep tree, on the other hand, it would take us six jumps to get to the same element:
body.children[0].children[0].children[0].children[0].children[0];A tree’s height is particularly important when we’re dealing with certain types of trees, such as Binary Search Trees (BST). This is why there are so many different data structures that implement self-balancing BSTs—so that we can keep the tree’s height to a minimum as it grows, and keep operations such as lookups as fast as possible.
So, back to the DOM. We know that the deeper a tree goes, the slower it is, in theory. But how does actually impact performance in practice?
Let’s run a little experiment to find out.
All the metrics reported here come from running a Performance profile using Google Chrome 125 (Incognito Mode) on an M1 Max MacBook with a 4x CPU Slowdown. You can check out the test page’s source code on GitHub.
To test this out, I put together a couple of HTML pages that contain nothing but three lines of text and 100 empty divs. The only difference between the two pages is that one has all the divs directly in the body of the document, while on the other, the divs are nested.
So the one with the shallow element tree looks something like this:
<html>
  <body>
    <div></div>
    <div></div>
    <div></div>
    <div></div>
    <!-- 95 divs later... -->
    <div>This is the last of 100 divs.</div>
  </body>
</html>
While the one with the deep tree looks like this:
<html>
  <body>
    <div>
      <div>
        <div>
          <div>
            <!-- 95 divs later... -->
            <div>This is the last of 100 divs.</div>
          </div>
        </div>
      </div>
    </div>
  </body>
</html>
Running a performance profile on the first page gave me a total page-load time (parsing + rendering + painting) of 51 milliseconds. While on the second one, page-load time was a whopping… 53 milliseconds.
So, that was a bit disappointing.
Sure, this isn’t a very meaningful example because all of the divs are empty and the browser is barely rendering a few lines of text on the screen, but I was still expecting to see a bigger difference.
Fortunately, and thanks to the magic of programming, testing with a larger number of divs only required a couple of keystrokes. So I tested with 200, then 300, then 400. At 500 divs, there was a clear difference in performance.
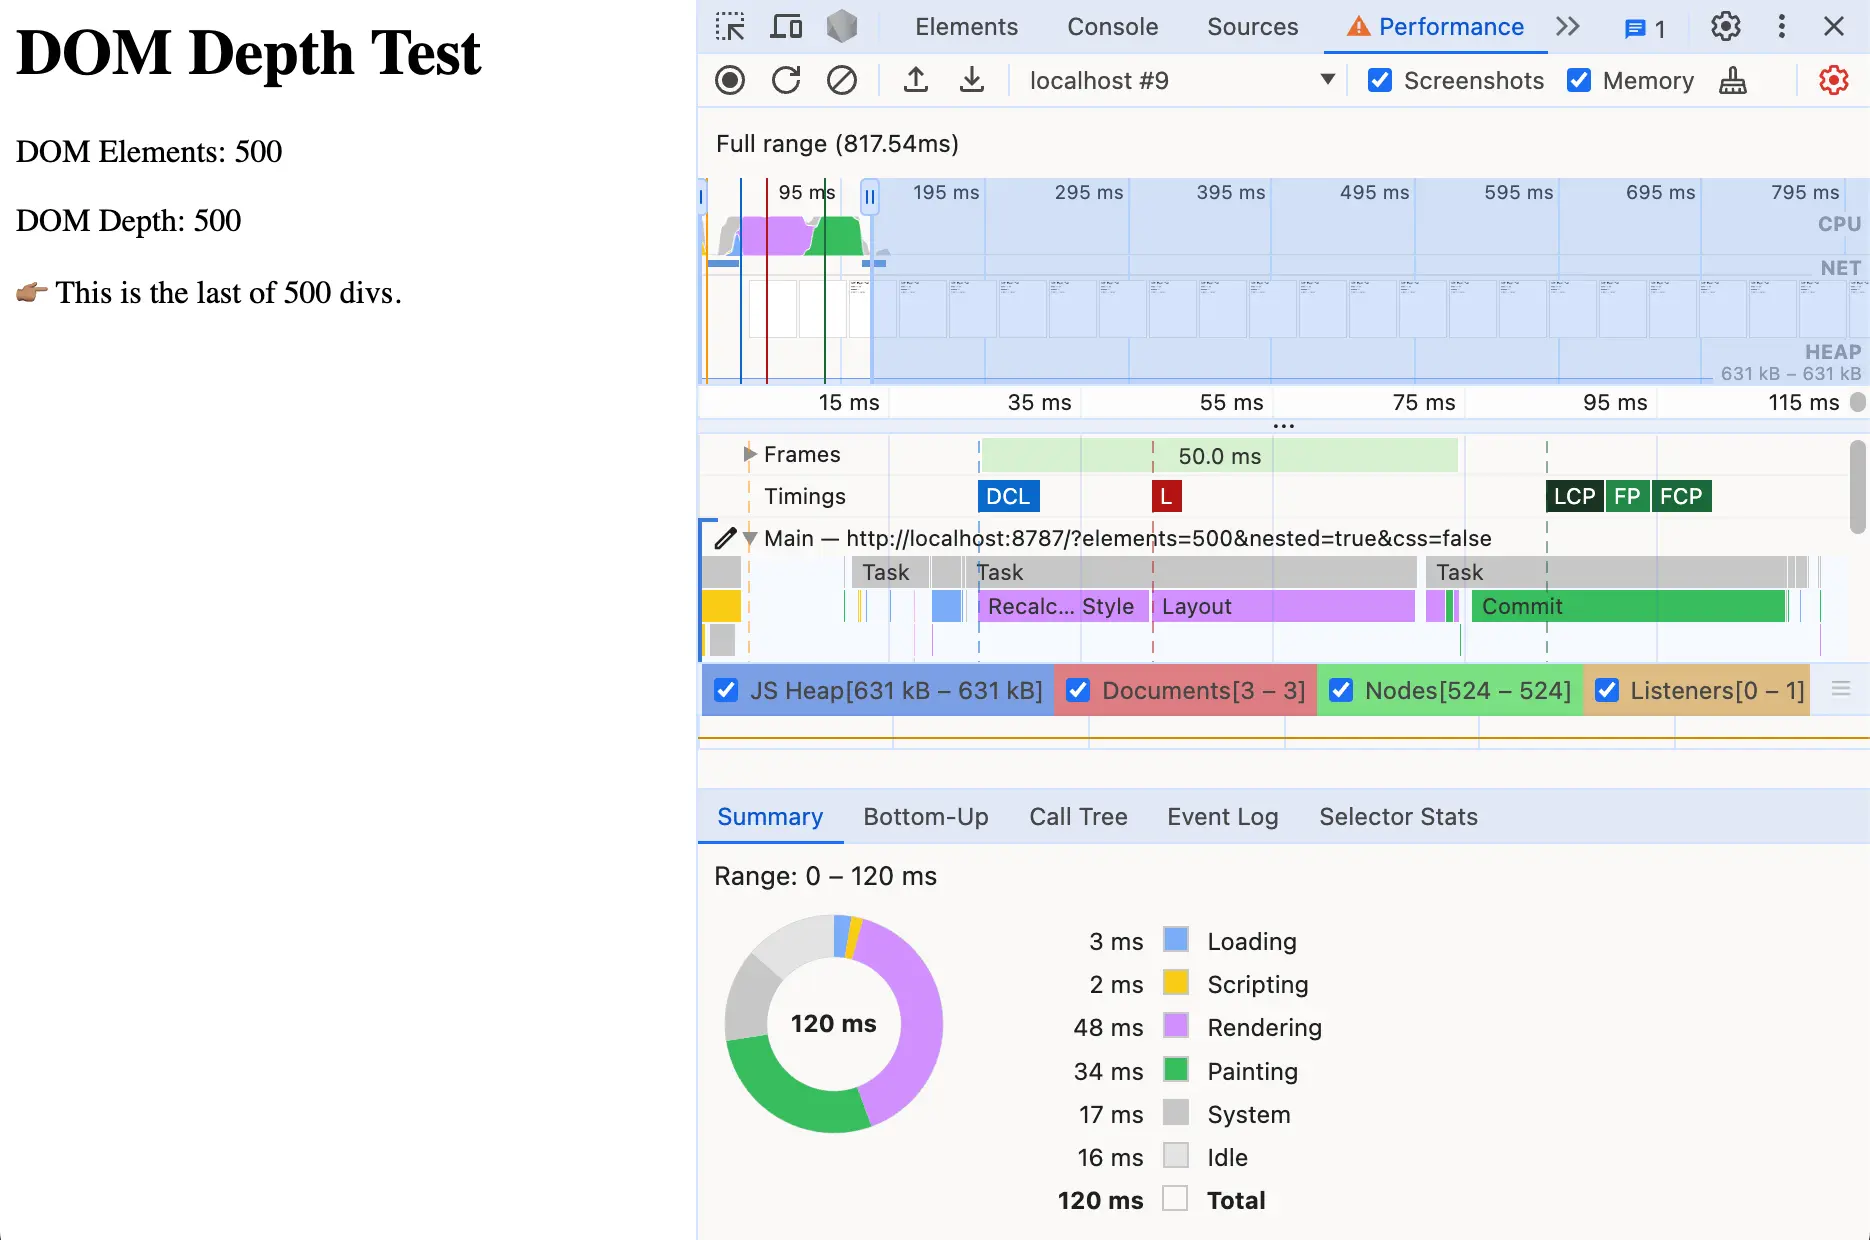
The shallow example rendered all 500 divs in 56ms—largely unaffected by the 5x increase in the amount of HTML it had to handle. But now the nested tree was taking 102ms—almost twice as much.
So I kept going, testing with up to 5,000 divs. Here are the results:
| DOM Elements | Flat Tree Load Time (ms) | Nested Tree Load Time (ms) |
|---|---|---|
| 100 | 51 | 53 |
| 200 | 55 | 58 |
| 300 | 55 | 74 |
| 400 | 58 | 87 |
| 500 | 56 | 102 |
| 600 | 62 | 116 |
| 700 | 66 | 145 |
| 800 | 78 | 151 |
| 900 | 77 | 165 |
| 1,000 | 83 | 189 |
| 2,000 | 101 | 339 |
| 3,000 | 121 | 509 |
| 4,000 | 142 | 667 |
| 5,000 | 166 | 844 |
It’s worth noting that both the page with the shallow tree and the one with the nested tree are identical in size. They both contain the same amount of elements and they look exactly the same when rendered on the browser.
The only difference is the depth of the DOM tree, which as we can see in the chart above does have an impact on rendering performance.
Now, you might be thinking that a DOM depth of 5,000 is a ridiculous thing to even consider because no real website is ever going to be that bad… and you’d be absolutely right.
But to be fair, 5,000 total elements is not really that uncommon, and on a real website all of those elements won’t be at the same level of depth like in the shallow tree example.
Even with a relatively low depth of 32, it would still take a few hundred milliseconds to parse, render, and paint that many elements—and this is all before CSS and JS kick in and make things much worse.
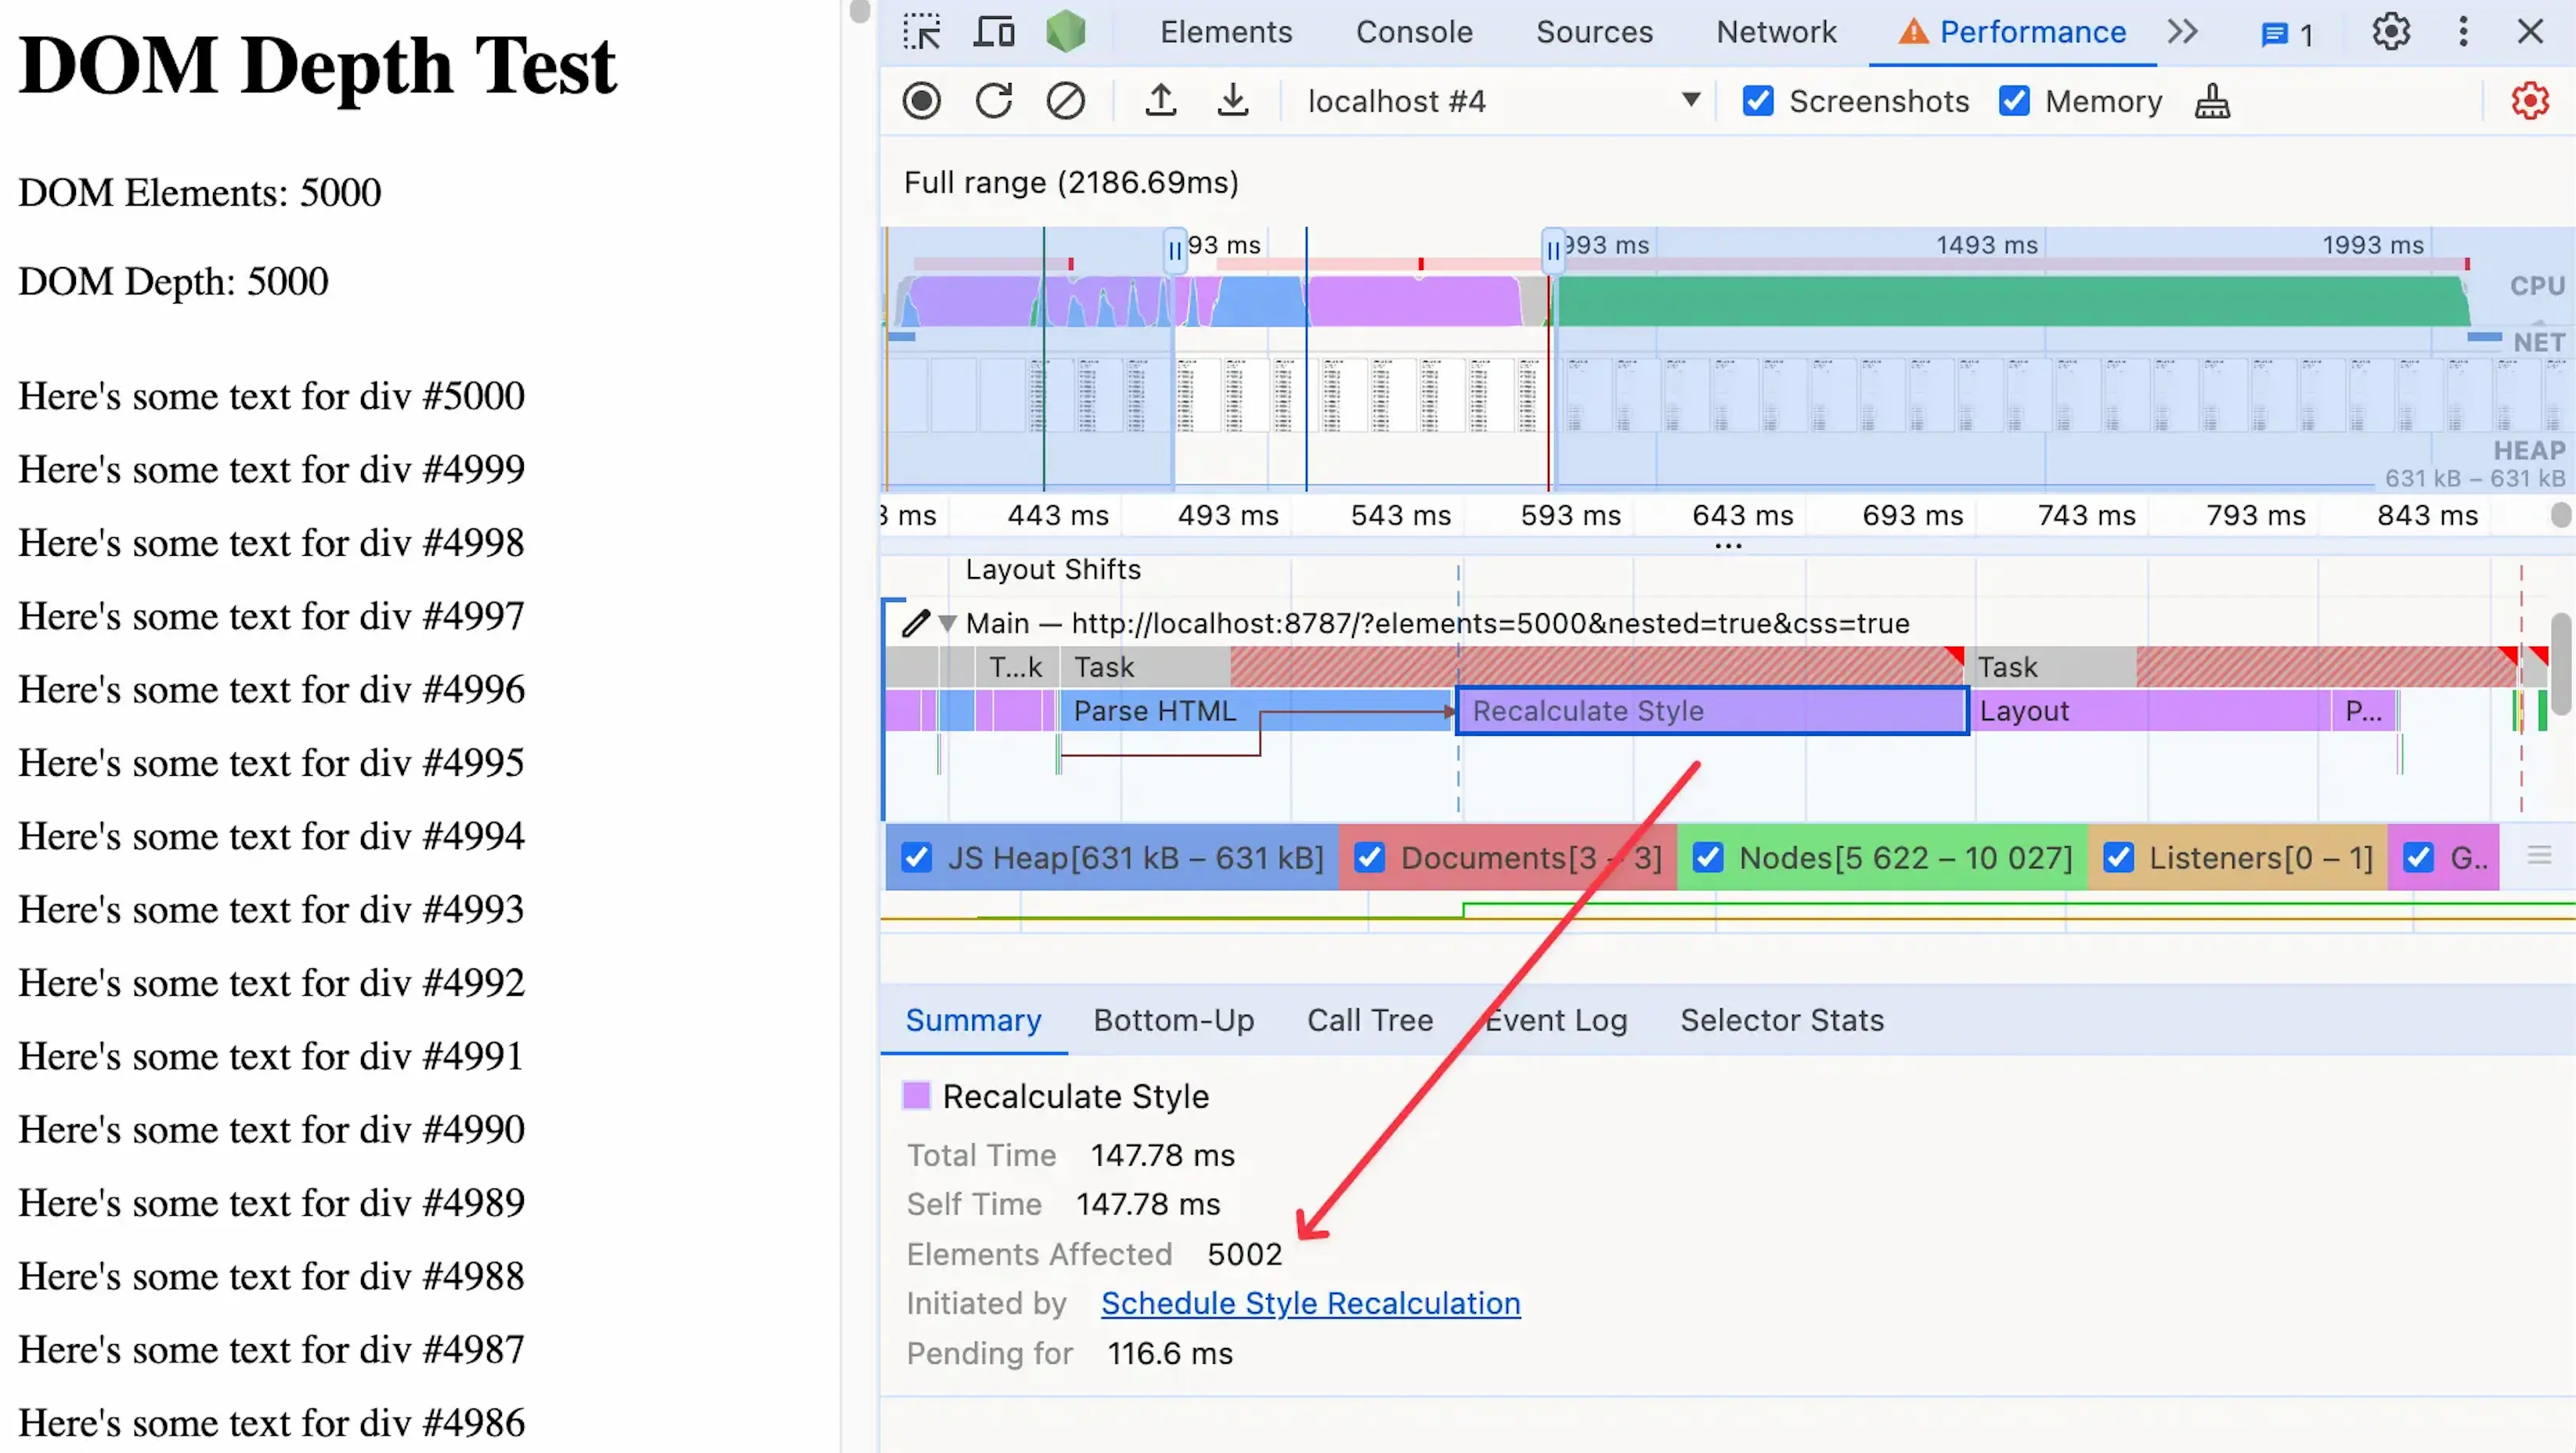
Speaking of CSS, one of the reasons large and deep DOM trees can be problematic is that they open the door for expensive style recalculations.
If we take our 5,000 nested divs example and add a bit of text to each div, we could test the impact of style recalculations by adding just a single CSS rule:
div {
  padding-top: 10px;
}
Since this rule affects almost every element on the page, the browser has to spend a long time figuring out the updated position of each one of our divs. This expensive style recalculation task could block the main thread and make our site unresponsive.
We’re only measuring page-load performance in this experiment, but keep in mind that users will interact with your page after the initial load as well.
This is why keeping an eye on DOM size and depth is so important. Not because they would make your site load slower, but because they establish the baseline on top of which all other runtime operations will perform (such as updating the DOM via JavaScript as part of a user interaction.)
So what can we do about this?
The main thing is to periodically check your DOM size and depth. I know this sounds obvious, but since we typically work with UI components or template partials that only expose us to a bit of HTML at a time, it’s easy to forget about how these bits of markup add up.
You can measure DOM size and depth on your site using a tool like Lighthouse or PageSpeed Insights. If you want to quickly check how many elements you have on the page at any given time, you can run this on your browser’s console:
document.querySelectorAll("*").length;Another thing that helps a lot is reducing the scope and complexity of your CSS selectors. This gives the browser an easier time finding the elements you’re trying to target and helps perform style recalculations much faster.
I have two main takeaways from this little experiment.
The first one is that modern browsers are amazing. The fact that they can parse, render, and paint a DOM tree nested thousands of levels deep in a matter of milliseconds is absolutely incredible.
As we mentioned before, there’s no real-world use case where 5,000 levels of depth would be necessary, but it’s really cool to see that browsers (at least Chrome, which is the one I tested with) are optimized to handle the load anyway.
The second takeaway is that DOM size and DOM depth have a bigger impact on a site’s performance than I originally thought, especially when combined with expensive style recalculations.
They might not be as impactful as expensive JavaScript operations, but they do make a difference (and they add up quickly), so it’s worth keeping an eye on them.
For much more on this topic, check out these resources:

Well, there's only one way to find out!
Join 2,000+ developers getting the latest insights from the world of software design and architecture—tailored specifically to frontend engineers. Delivered right to your inbox every two weeks.
“Maxi's newsletter is a treasure trove of wisdom for software engineers with a growth mindset. Packed with valuable insights on software design and curated resources that keep you at the forefront of the industry, it's simply a must-read. Elevate your game, one issue at a time.”